Governance
Cost
What AI is costing you, where it goes, and what it was spent on, per day and per app.
On this page
Open Reporting and choose Cost to see what AI is costing you, where it goes, and what it was spent on.
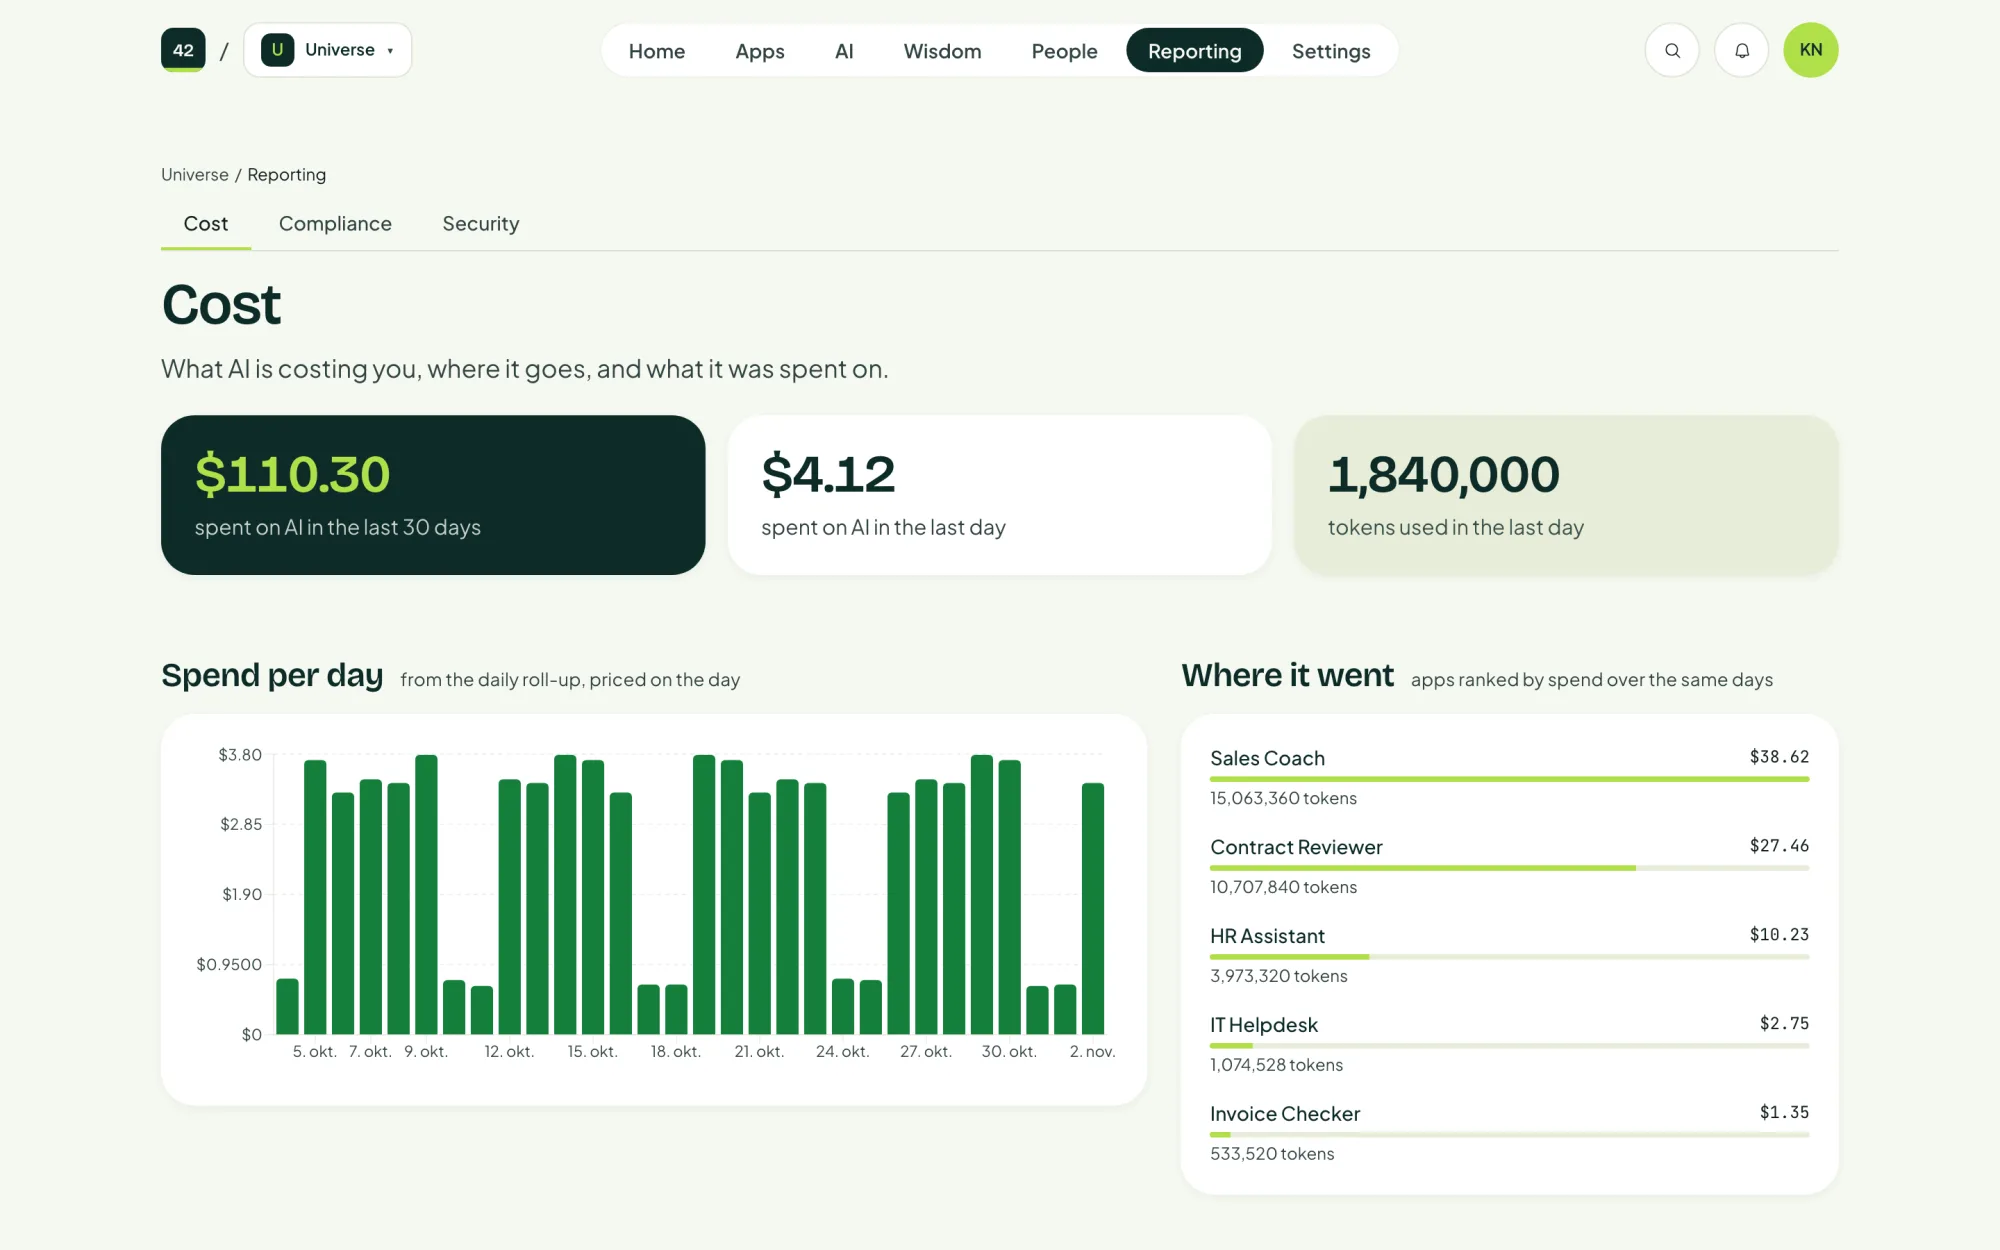
What it shows
| Figure | What it means |
|---|---|
| Spent on AI in the last 30 days | Total model spend across every app. |
| Spent on AI in the last day | Yesterday's spend, with the tokens used. |
| Spend per day | A chart from the daily roll-up, priced on the day. |
| Where it went | Apps ranked by spend over the same days. Spend that is not tied to an app is shown on its own row. |
Usage is collected by the AI gateway, so it covers every app without the apps having to report anything.
Note
The chart starts filling in the day after the platform is installed, when the first day has been rolled up. Usage on a model without a price is left out of the totals, and the page says so.
Keeping cost down
Last updated 2 November 2026
Edit this page on GitHub